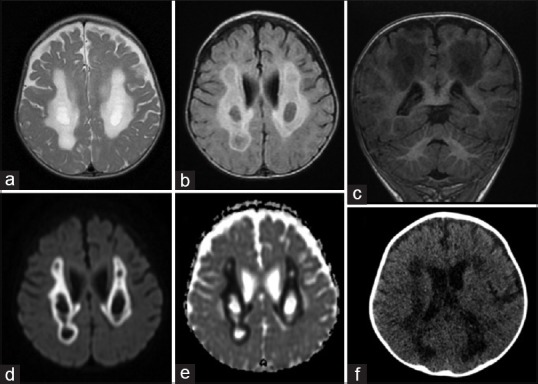
Figure 4.

Brain MRI, Axial T2 (a) and Flair (b), coronal T1 (c), diffusion (d) and apparent diffusion coefficient (e) sequences; Computed tomography (CT) scanner (f). Images showing diffuse abnormal intensity of the white matter involving periventricular regions
