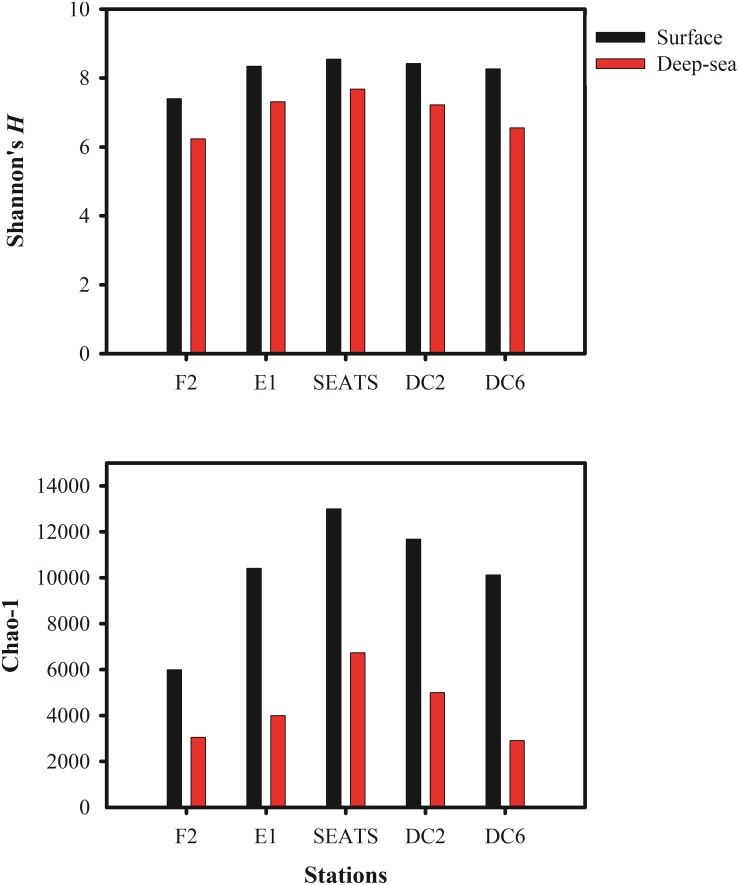
FIGURE 2.
The Alpha diversity indexes in South China Sea viromes (SCSV) data set. (A) Shannon’s diversity H’ calculated from the relative abundance of viral Operational Taxonomic Units (vOTUs) for each sample. (B) Chao 1 diversity calculated from relative abundances of vOTUs for each sample. The relative abundance is computed for each sample as the number of the transcripts per million reads mapped (TPM).

