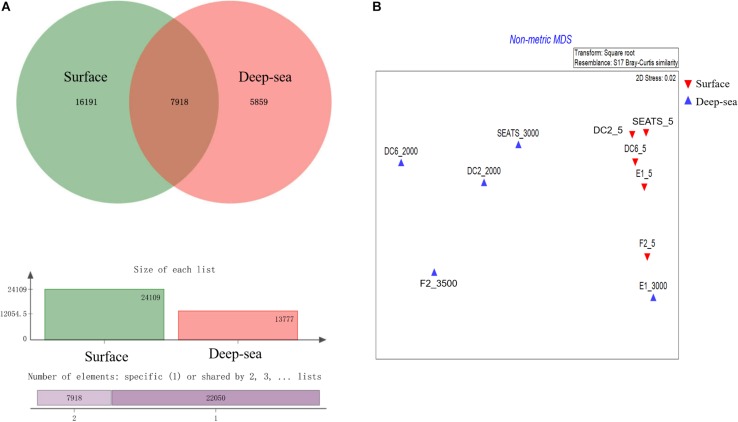
FIGURE 4.
Comparisons of the surface and deep sea viromes in the South China Sea viromes (SCSV) data set. (A) The venn graph of the viral Operational Taxonomic Units (vOTUs) of the surface and deep sea viromes. (B) The Non-metric multidimensional scaling (NMDS) of SCSV based on the Bray-Curtis dissimilarity matrix calculated from the relative abundance of vOTUs from the SCSV data set.

