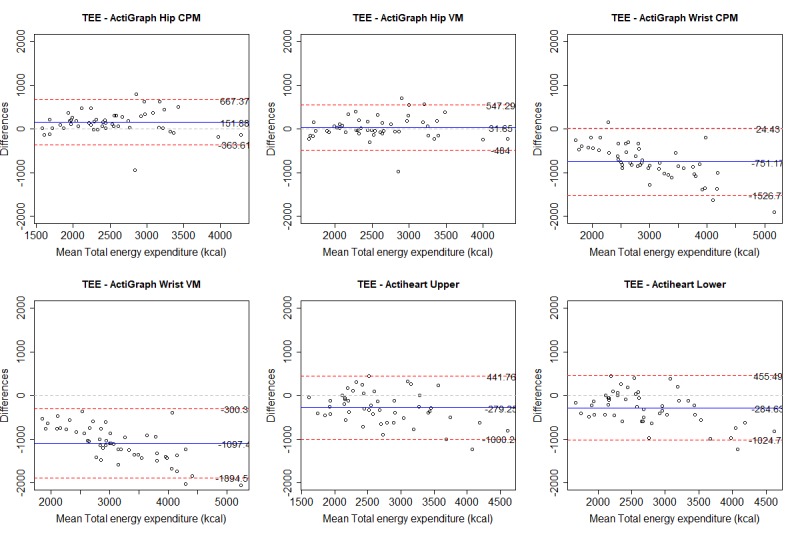
Figure 5.

Bland-Altman plots for the Polar M430 and each criterion measure for total energy expenditure (TEE). Numbers are mean difference and upper and lower limits of agreement (95% CI). CPM: counts per minute; VM: vector magnitude.

Bland-Altman plots for the Polar M430 and each criterion measure for total energy expenditure (TEE). Numbers are mean difference and upper and lower limits of agreement (95% CI). CPM: counts per minute; VM: vector magnitude.