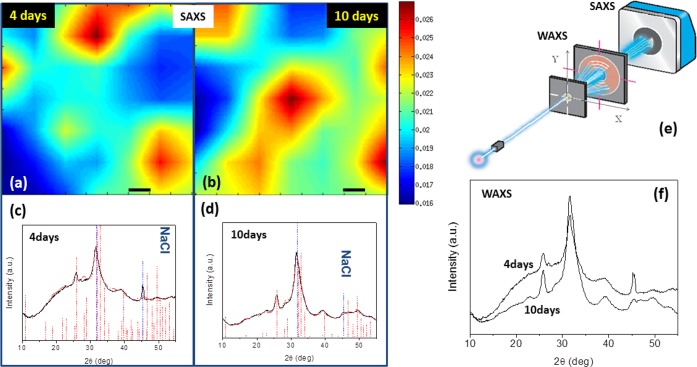
Figure 3.
(a, b) Scanning SAXS microscopy (scale bar is 0.1 mm). (c, d) Corresponding WAXS spectra. (e) Geometry adopted for SAXS and WAXS data collection. (f) Raw WAXS data superimposed for samples at 4 days and at 10 days. WAXS data identify the hexagonal hydroxyapatite (red markers) as the unique crystalline structure present in the differentiated bMSCs (residual NaCl in the sample is also marked by the blue dashed vertical bars). The best fits (red profiles), obtained for samples of 4 days (c) and 10 days (d), are superimposed on the experimental data (black profiles).

