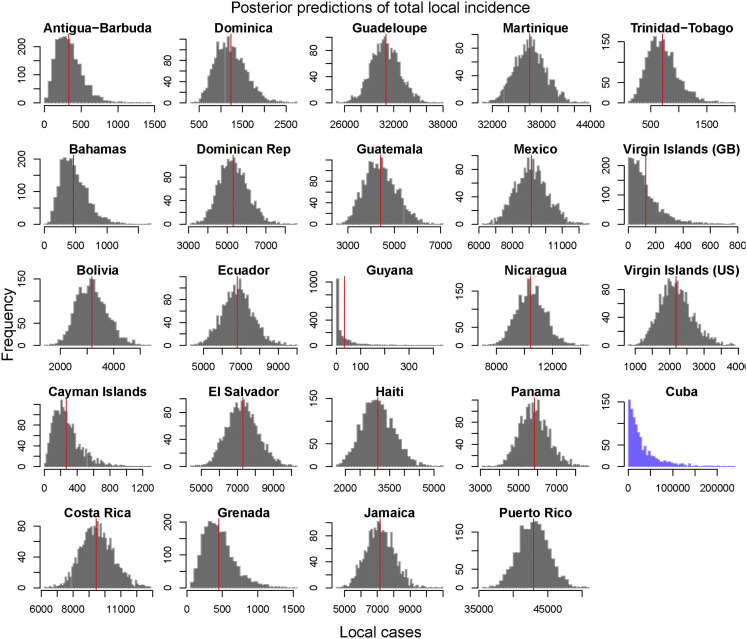
Figure S5.
Posterior Predictions of Estimated Total Local Incidence from Origin Country into Florida, Related to Figure 2
These distributions were used to inform the joint distribution between travel incidence and local incidence that was used to estimate local incidence in Cuba. Empirical total local cases per country indicated by red vertical line. Estimated local incidence of Cuba indicated in blue with no empirical value. All of the countries shown above, besides Cuba, had > 0.25 correlation between local incidence and travel incidence and had the observed value fall within the 95% posterior predictive interval of the distribution.

