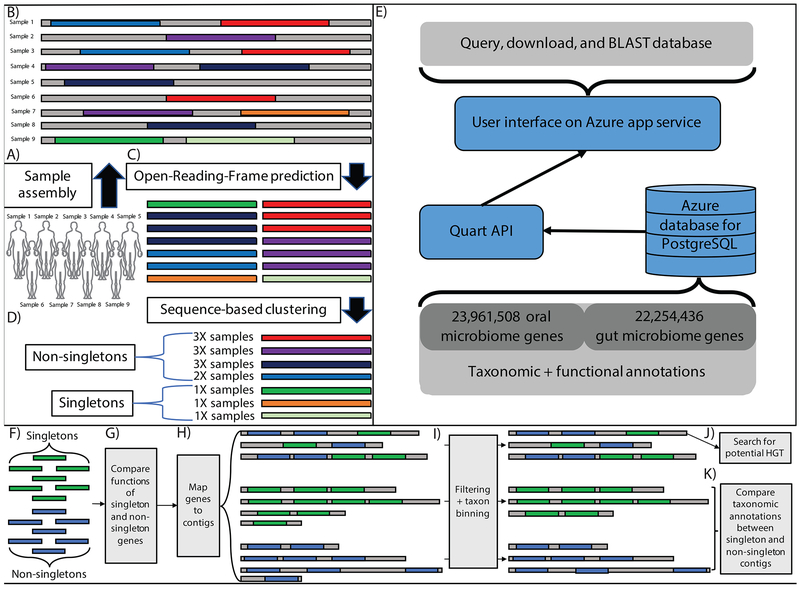
Figure 1: Meta-analysis of the oral and gut microbiomes.
A-B) We aggregated publically available oral and gut short read data and assembled it into contigs (in this example, each contig comes from a single sample). C) Gene open-reading-frames (ORFs) are identified on assembled contigs D) ORFs are clustered at 95% identity to identify a non-redundant gene catalog E) Database content, description of backend, description of UI F-K) Downstream singleton analytical pipeline. F) We identify singletons and non-singletons in our dataset and G) compare their functional annotations. H) We then map genes to contigs, which we group into 3 categories: singleton-contigs (those consisting of only singletons), non-singleton contigs (those consisting of only non-singletons) and mixture contigs (those consisting of both singletons and non-singletons). i) We filter short contigs and bin the remainder according to the taxonomic classification of their gene content. We then attempt to identify the source of singletons as either J) horizontal gene transfer (HGT) and/or K) rare, singleton-rich microbial strains.

