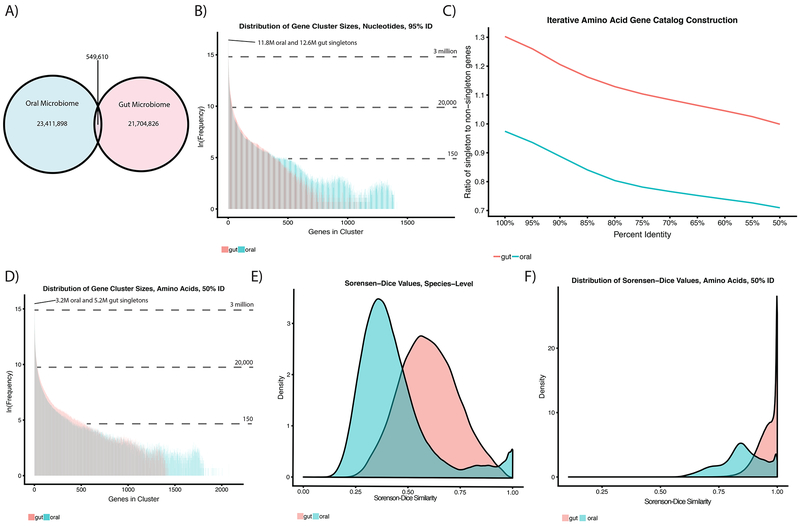
Figure 2: The genetic diversity of the oral and gut microbiomes.
A) The overlap in genetic content (95% identity level) between the oral and gut microbiomes. B) Distribution of ORF cluster sizes at 95% identity in our oral (blue) and gut (red) gene catalogs. C) Iterative clustering of our amino acid gene catalogs. D) Distribution of gene cluster sizes for amino acid gene catalogs generated at the 50% identity level. E) Sorensen-Dice index measuring dissimilarity in gene content between all pairs of individuals. F) Sorensen-Dice dissimilarity of individuals in terms of MetaPhlAn2-derived species content.

