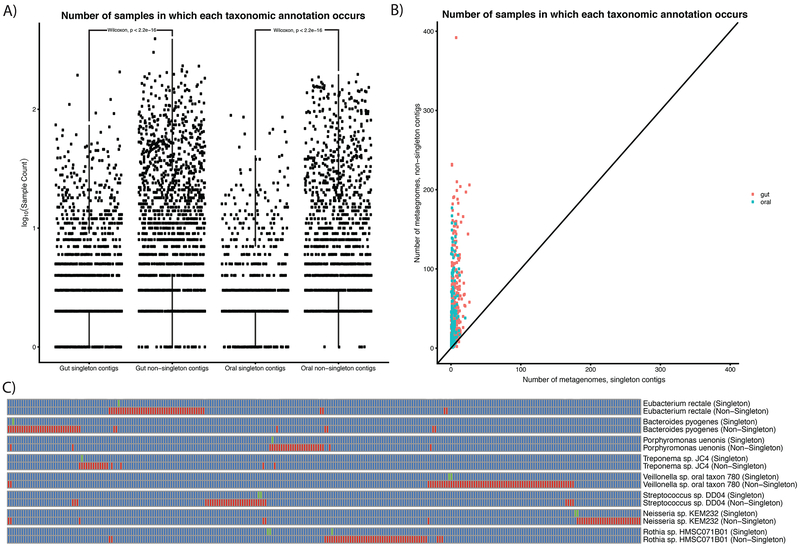
Figure 5: Singleton taxa as sub-population specific, rare strains.
A) Counts of taxonomic annotations for singleton and non-singleton contigs in the oral and gut microbiomes. B) Number of metagenomes singleton contigs and non-singleton contigs are present in for different taxonomies. Each point represents a different taxonomic annotation. C) Examples of strain-specific “fingerprints.” Each pair of rows corresponds to singleton and non-singleton contigs containing at least two genes that were binned into the same taxonomic annotation. Columns are different metagenomic samples (each corresponding to a different individual). Green boxes correspond to singleton contigs. Red boxes correspond to non-singleton contigs.

