Figure 1.

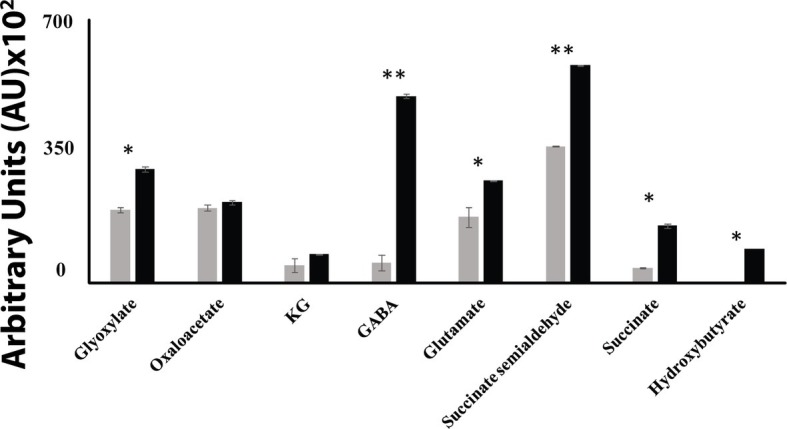
HPLC of metabolic profiles from control (gray bars) and Mn-treated cells (black bars) at stationary phase of growth. Data are presented as mean ± SD and are representative of three independent experiments (*p < 0.05; **p < 0.01).

HPLC of metabolic profiles from control (gray bars) and Mn-treated cells (black bars) at stationary phase of growth. Data are presented as mean ± SD and are representative of three independent experiments (*p < 0.05; **p < 0.01).