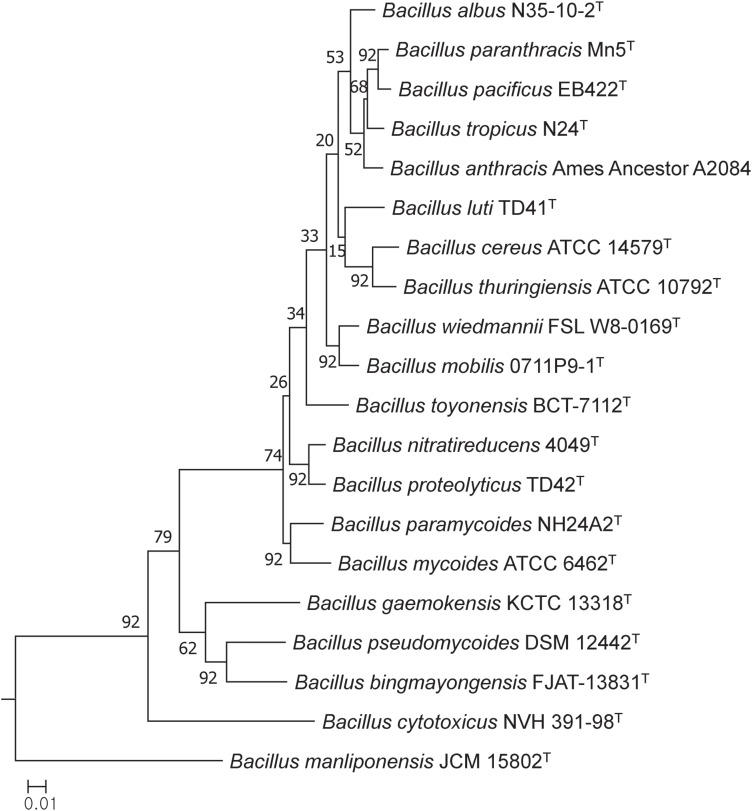
FIGURE 1.
Maximum-likelihood tree based on 92 single copy core gene sequences showing relationships between the type trains of B. cereus and B. thuringiensis and between them and corresponding strains of other B. cereus sensu lato species. The numbers at the nodes are bootstrap values based on 1000 replicates. The bar stands for the number of substitutions per nucleotide.

