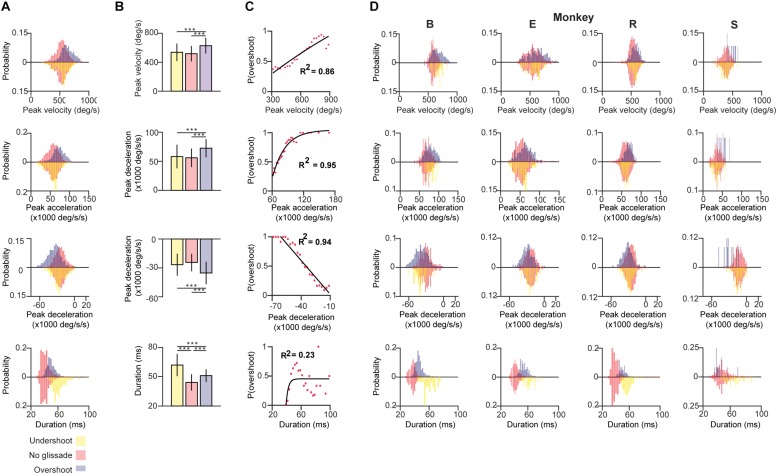
FIGURE 3.
Kinematics of saccades with undershoot, overshoot or no glissade. (A) Probability density histograms of saccade kinematics of all animals combined. Red bars represent kinematic parameters of saccades without a glissade, purple bars represent saccades with glissadic overshoots and yellow bars saccades with glissadic undershoot. Red up and downward bars represent the same data to clearly compare the effect of undershoots and overshoots. (B) Average kinematics of saccades from all animals with glissade ± SD. (C) Linear or exponential regression analysis on the probability of having a saccadic with overshoots and kinematic parameters. (D) Histograms of the same kinematic parameters as represented in (A) for individual animals. “B,” “E,” “R,” and “S” denote each of the four monkeys. ‘∗∗∗’ symbols denote p-values of <0.001.

