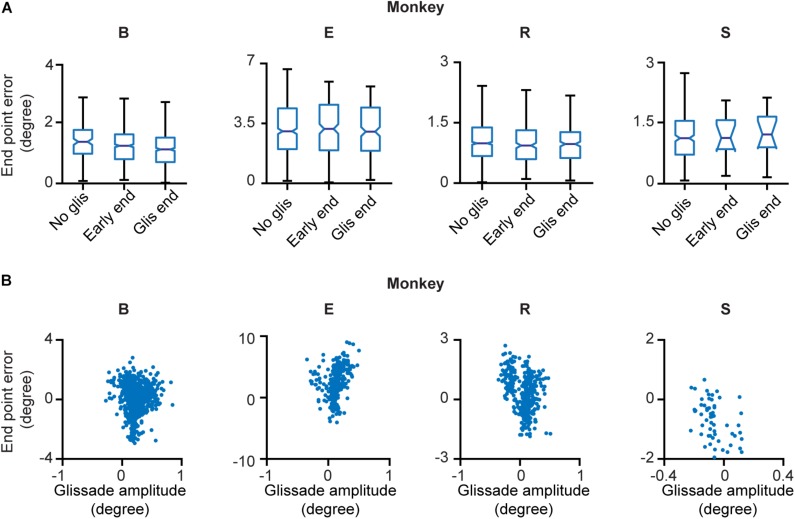
FIGURE 4.
End point errors at onset and offset of the glissade and of saccades without a glissade. (A) The first box in every panel represents the average endpoint error of saccades without a glissade (“No glis”). The second box represents the end point error of the saccade at the onset of the overshooting glissade (“Early end”; green arrow in Figure 1B). The third box shows the end point error of the saccade at the end of the overshooting glissade (“Glis end”; blue arrow in Figure 1B). No significant differences were observed. (B) Scatter plots of signed end point saccade errors (negative – hypometric saccades; positive – hypermetric saccades) and glissade amplitudes (negative – undershoots; positive – overshoots) of individual animals. See Supplementary Table 2 for p-values of (A) and correlation coefficients of (B). Labels “B,” “E,” “R,” and “S” denote each of the four monkeys.

