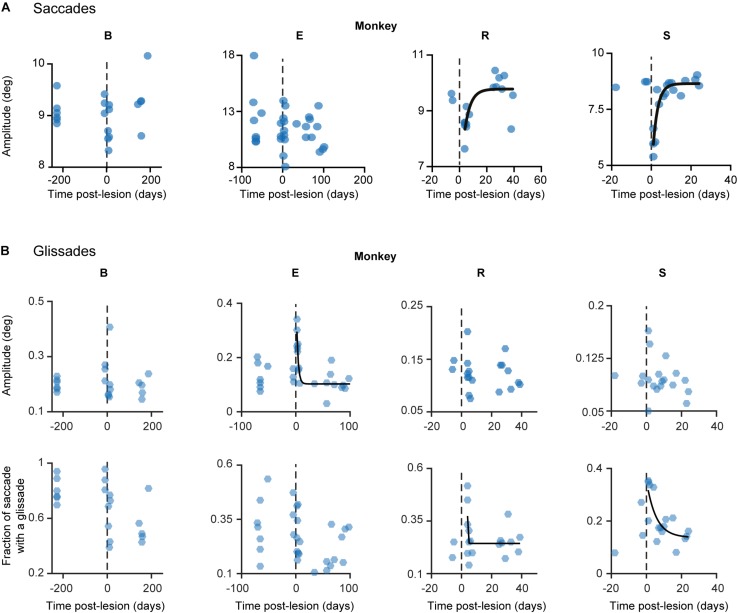
FIGURE 5.
Development of lesion phenotypes over time. (A) Saccade amplitude per monkey plotted over time. Blue dots represent average saccade amplitude per experimental day including all directions pooled together, black fits represents exponential fit (f(x) = a∗exp(−x/b) + c). (B) Same as in (A) but the hexagons indicate glissade amplitude and fraction. See Supplementary Table 3 for p-values and coefficient of determination. Fraction is defined as the number of saccades containing a glissadic overshoot. Only overshooting glissades were used for this analysis. Labels “B,” “E,” “R,” and “S” denote each of the four monkeys.

