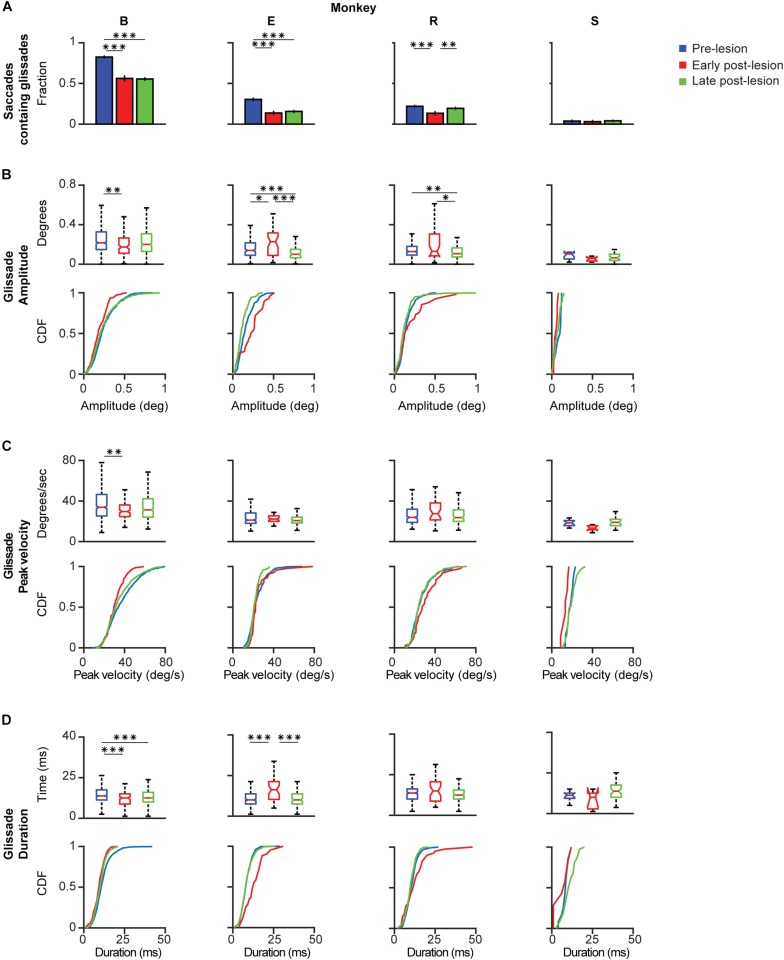
FIGURE 6.
Post-lesion changes to glissadic overshoots. Glissade kinematics were sorted in a pre-, early, and late post-lesion groups. Early post-lesions was defined as the day of the lesion + 3 half-lives of the exponential fit in Figure 5, everything thereafter was classified as late post-lesion (for more details see section Results). Number of days that were classified as early post-lesion period is shown in the bottom row of Supplementary Table 3. (A) Fractions of saccades with a glissade for individual monkeys. Error bars represent Jeffrey’s interval for proportions. (B) Box plots and [Cumulative Distribution Function (CDF)] of glissade amplitudes for individual monkeys. Boxes edges indicate 25th and 75th percentile, box midline indicate the median. Whiskers extend to the most extreme data points not considered outliers. (C) Box plots and CDF of glissade velocities. (D) Box plots and CDF of glissade durations. Only overshooting glissades were used for this analysis. See Supplementary Table 4 for p-values. Labels “B,” “E,” “R,” and “S” denote each of the four monkeys. ‘∗’ symbols denote p-values of <0.05; ‘∗∗’ symbols denote p-values of <0.01; ‘∗∗∗’ symbols denote p-values of <0.001.

