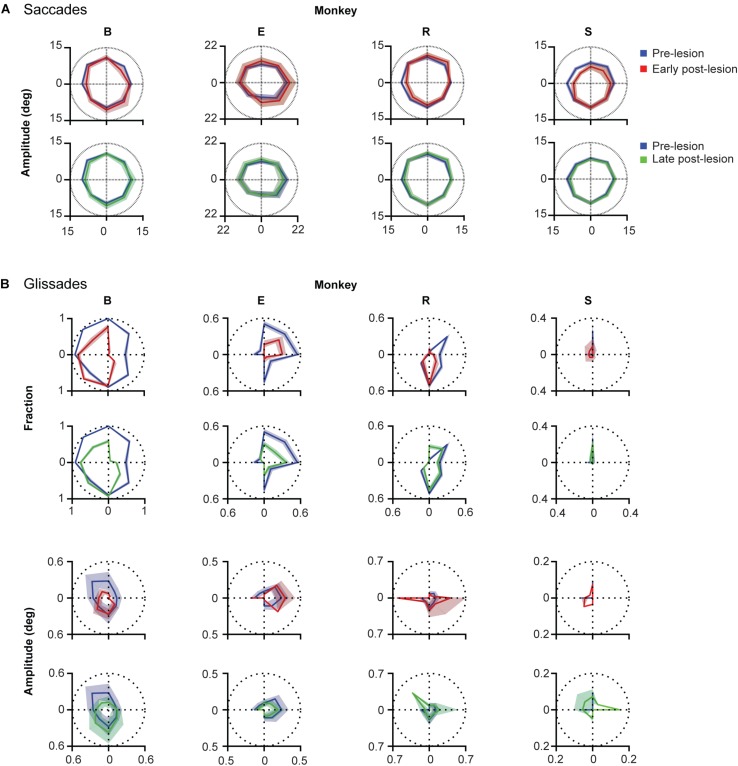
FIGURE 7.
Direction specificity of lesion phenotype for glissades and saccades sorted for saccade direction. (A) Effect of lesion on saccade amplitude in different directions. Blue lines represent pre-lesion condition, red lines represent early post-lesion condition and green lines represent late post-lesion condition. (B) Top two rows show fractions of saccade with a glissade sorted for saccades in each of the eight cardinal directions. Shading of fractions represent Jeffrey’s interval. Bottom two rows show average glissade amplitude for saccades in each of the eight cardinal directions. Shading of amplitudes plots represent one standard deviation. Only overshooting glissades were used for this analysis. See Supplementary Table 5 for p-values and correlation coefficients between lesion time epochs. Labels “B,” “E,” “R,” and “S” denote each of the four monkeys.

