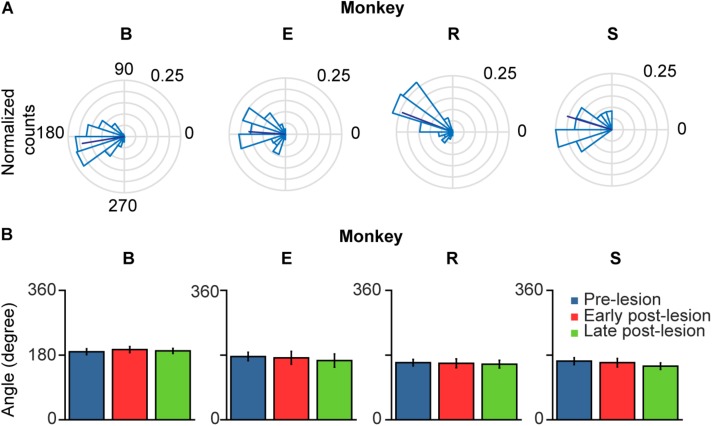
FIGURE 8.
Polar plots of glissade angle relative to saccade. (A) Normalized polar histograms of glissade direction relative to saccade direction (all saccade directions set to 0°, glissade direction relative to saccade direction is defined as θsaccade – θglissade) in the pre-lesion period. Dark blue line represents average vector of all glissade angles. (B) Mean glissade direction relative to saccade for pre-lesion and early and late post-lesion period. Only overshooting glissades were used for this analysis. Error bars represent one standard deviation. P-values of individual tests are in Supplementary Table 6. Labels “B,” “E,” “R,” and “S” denote each of the four monkeys.

