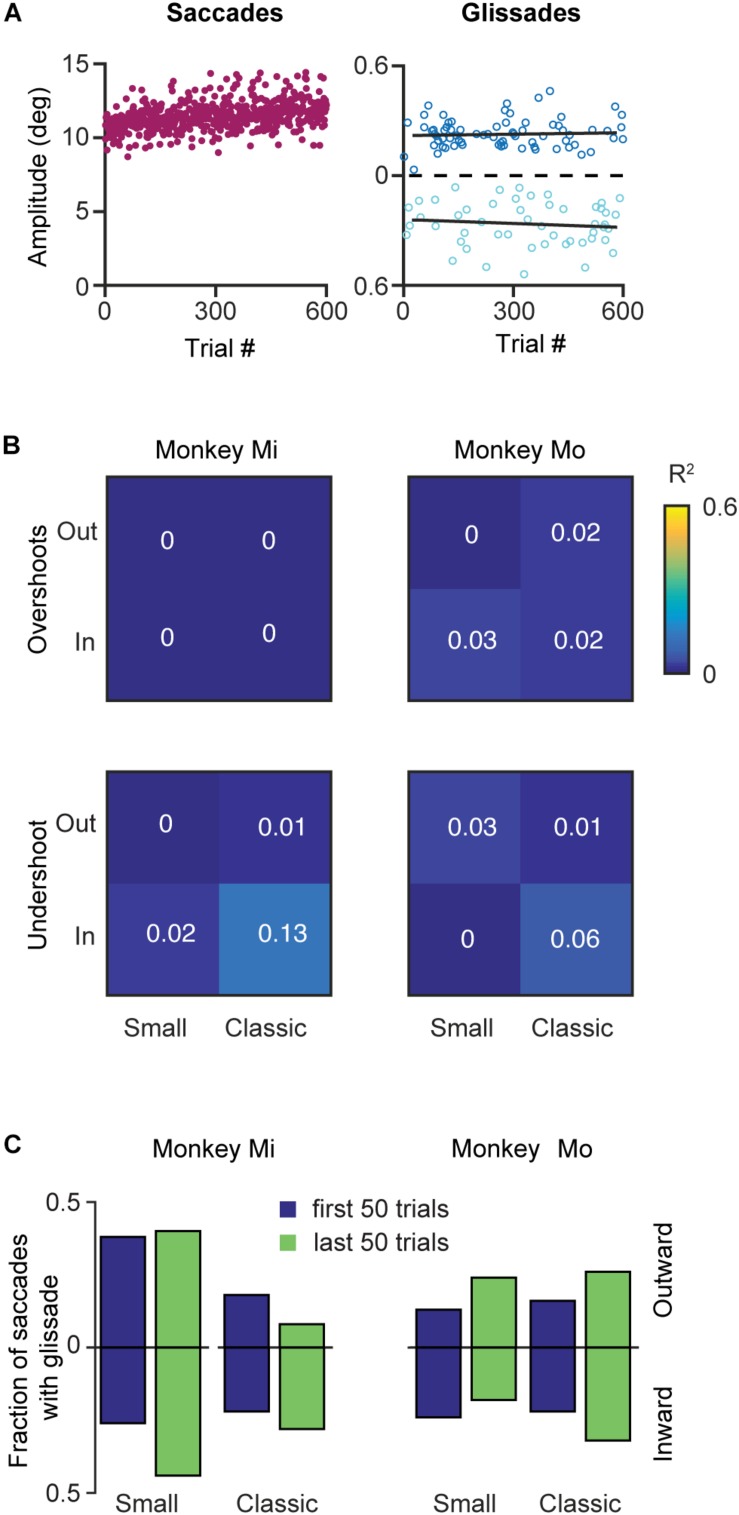
FIGURE 9.
Effects of saccadic adaptation on glissades. (A) Example of a classical outward saccadic adaptation experiment from monkey Mo. Left panel, purple dots correspond to the saccade amplitudes gradually increasing over time. Right panel, dark blue dots display amplitude of the glissadic overshoots and light blue dots display amplitudes of the glissadic undershoots. Black lines represent a linear fit. (B) Top panels display R2 of linear fits of glissadic overshoot amplitudes during inward and outward saccadic adaptation with a classical and small adaptation step. The bottom panels display the same for undershoots. Monkey Mi did not make any glissadic overshoots. Labels “Mi” and “Mo” denote each of the two monkeys. (C) Fraction of saccades with overshooting and undershooting glissades pooled in the first and last 50 trials of the adaptation. Upward bars represent outward saccadic adaptation experiment and downward bars represent inward saccadic adaptation experiments for p-values see Supplementary Table 7.

