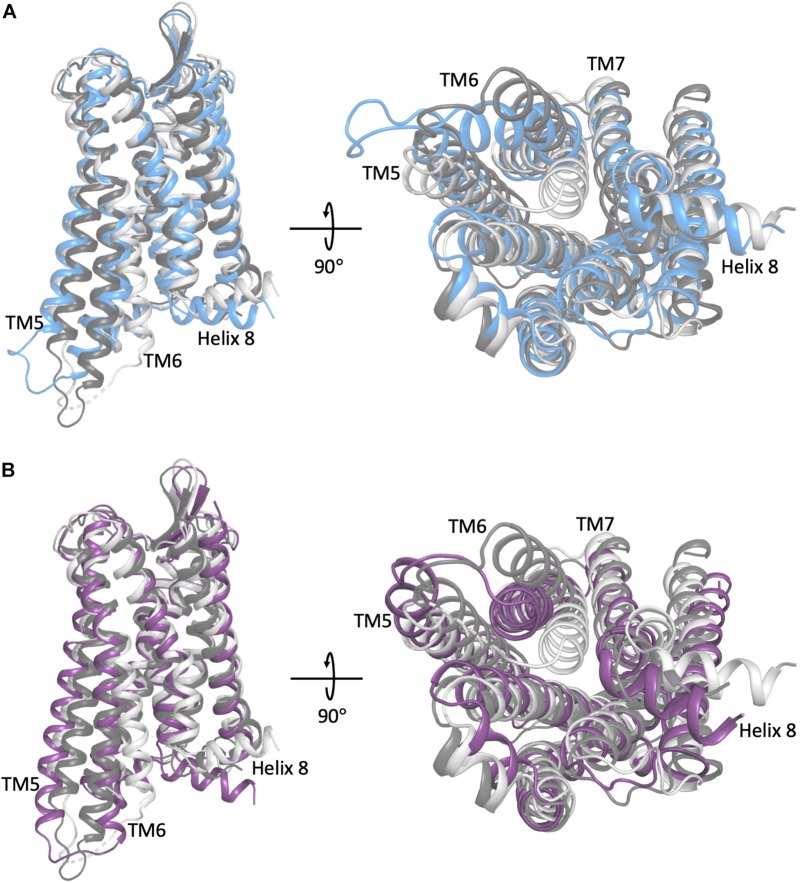
FIGURE 1.
A comparison of the representative conformation of the most probable metastable state within an intermediate region of (A) the morphine-bound MOP receptor, where the intermediate state is in light blue, and (B) the TRV-130-bound MOP receptor, where the intermediate state is in light purple, relative to the experimentally determined MOP receptor inactive and active states (light and dark gray, respectively). Note that the most dramatic differences between these conformations stem from the extent of outward movement of TM6 away from TM3, which is one of the most notable conformational changes that has been associated with receptor activation. Images on the right correspond to a 90° rotation of the receptor helical bundle, and represent the view from the intracellular domain.

