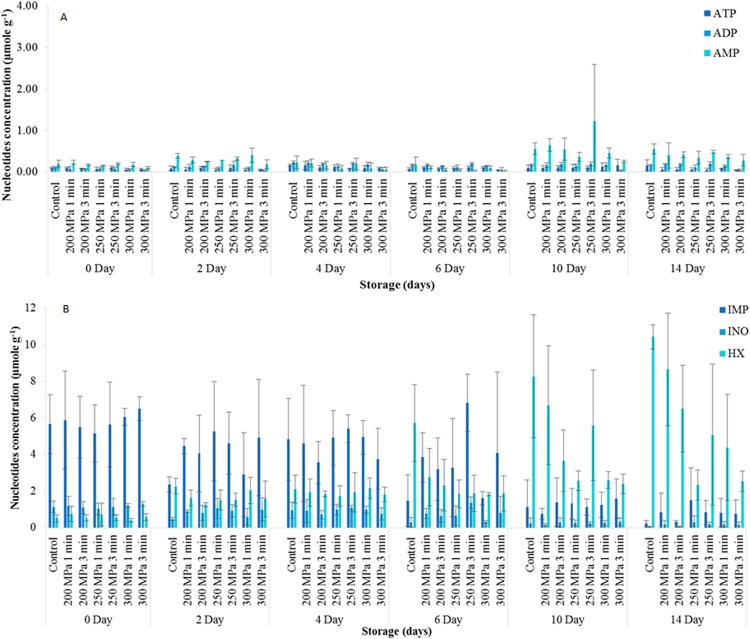
Figure 3. Nucleotide degradations (µmole g−1) of herring untreated and treated in high pressure processing during 14 days of storage.
(A) shows the degradation of ATP, ADP and AMP of herring, and (B) shows the degradation of IMP, Inosine and Hypoxanthine of herring during 14 days of storage. Data expressed as mean values ± standard deviation, n = 3. ADP, adenosine diphosphate; ATP, adenosine triphosphate; AMP, adenosine.

