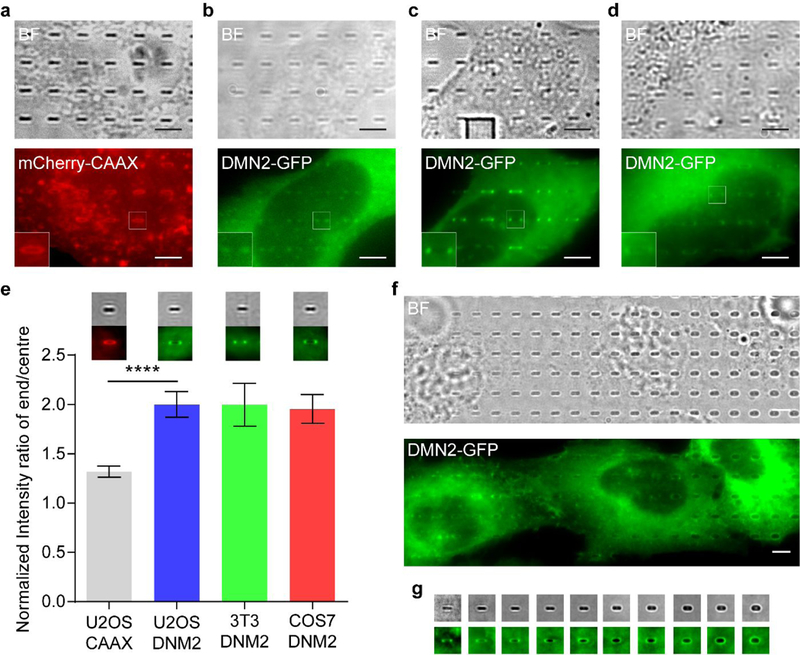
Fig. 10 |. Probing DNM2 on nanostructures.

a, Micrographs of a part of U2-OS cell expressing mCherry-CAAX on nanobars, b-d, Micrographs of a part of a cell expressing DMN2-GFP on nanobars. The cells are U2-OS (b), 3T3 (c) and COS7 (d), respectively. Insets are zoom-in views of the corresponding regions in the fluorescence images, e, Quantitative analysis of end/centre ratios of fluorescence intensity values on 200 nm wide nanobars. Insets are the averaged fluorescence images of each cell line according to the bar chart. Error bars represent standard error of mean. Statistical significance of mCherry-CAAX versus DNM2-GFP in U2-OS was evaluated by an unpaired t-test with Welch’s correction. ****p < 0.0001. f, Micrographs of cells expressing DMN2-GFP on nanobars of 100–1000 nm width, g, Micrographs of nanobars of the same width ranging from 100 to 1000 nm, with a 100 nm incremental step. All the micrographs are generated by averaging fluorsecence images taken in live cell imaging. The protein distributions are measured by averaging over 41–181 nanobars. All the nanobars are 1 μm in height and 2 μm in length. Scale bars, 5 μm. “BF” denotes bright field.
