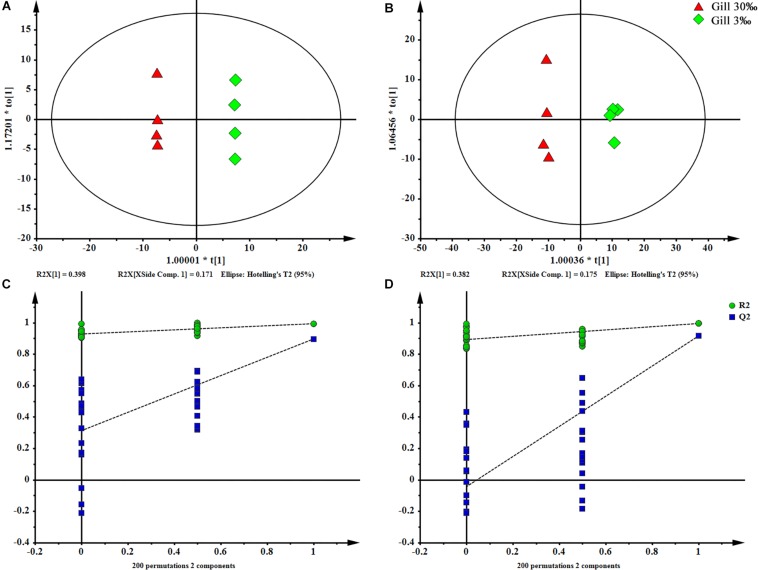
FIGURE 4.
OPLS-DA scores plot (A: ESI+; B: ESI–) and permutation test plots with a 200 permutation number (C: ESI+; D: ESI–) of gills at two salinities. The permuted Q2 (blue) values located on the left side of the graph were lower than the original points to the right, indicating the validity of the OPLS-DA model.

