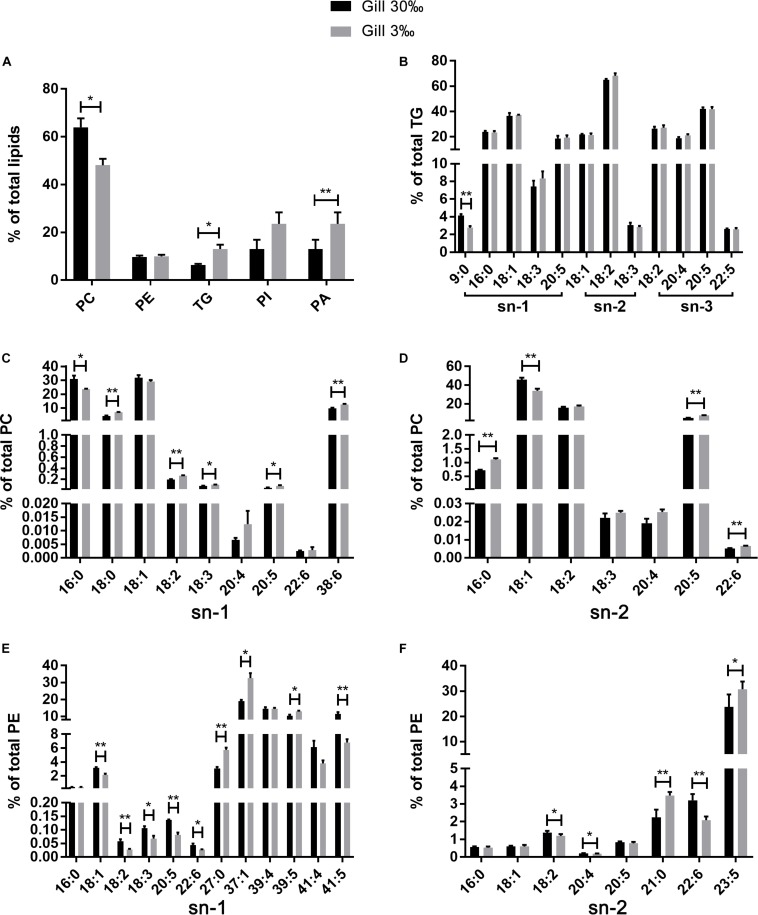
FIGURE 6.
The relative abundance of specific lipids in total lipids (A) and the positional distribution of individual fatty acids in total TG (B), total PC (C: sn-1 position; D: sn-2 position), and total PE (E: sn-1 position; F: sn-2 position) in gills of L. vannamei. Values are means ± SEM (n = 4). One asterisk (∗) and two asterisks (∗∗) indicate significant differences (P < 0.05) and highly significant differences (P < 0.01) between two salinities, respectively.

