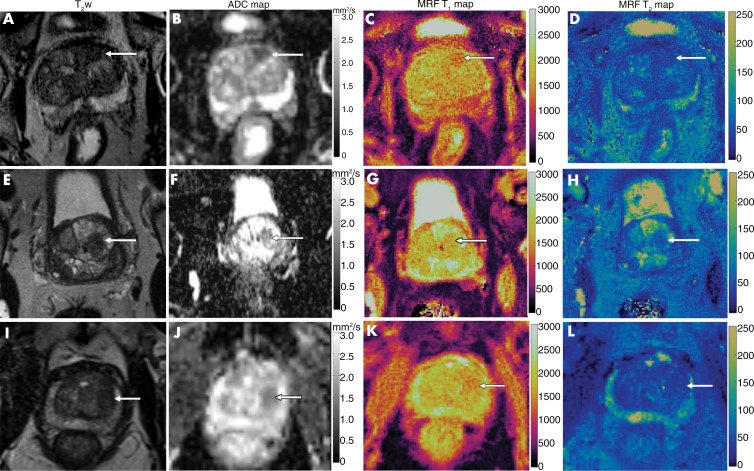
Figure 5:
Comparison of images from (left to right) axial T2-weighted MRI, apparent diffusion coefficient (ADC) mapping, and T1 and T2 MR fingerprinting mapping for targeted biopsy-proven prostate cancer, prostatitis, and a benign prostatic hyperplasia (BPH) nodule. A–D, Biopsy-proven prostate cancer (arrow). Mean T1, T2, and ADC were 1450 msec, 43 msec, and 0.51 × 10⁻³ mm2/sec, respectively. E–H, Biopsy-proven prostatitis (arrow). Mean T1, T2, and ADC were 1615 msec, 63 msec, and 0.83 × 10⁻³ mm2/sec, respectively. I–L, For the BPH nodule (arrow), mean T1, T2, and ADC were 1600 msec, 43 msec, and 0. 87 × 10−3 mm2/sec, respectively. Note the difference in T1 relaxation times between transition zone cancer and noncancers despite the lesions having similar hypointense signal intensity on T2-weighted images.

