Figure 2.
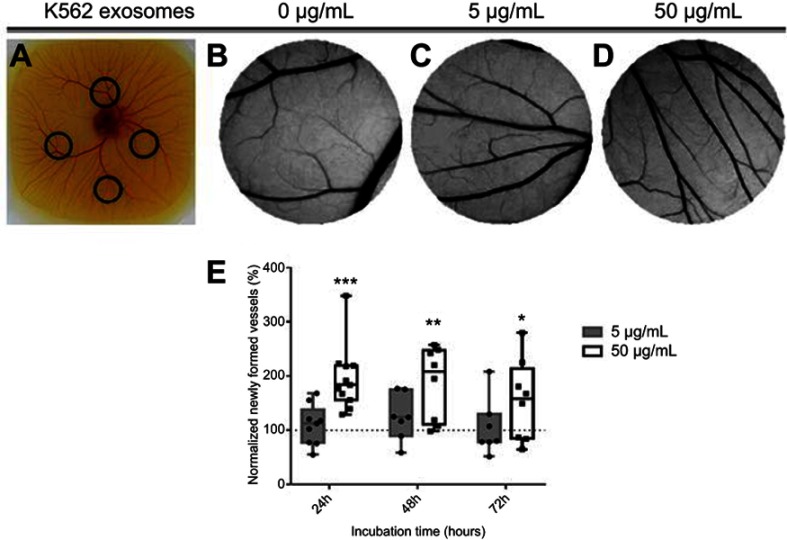
Image of the chicken embryo aspect (A) and of the interior of each O-ring placed on the chorioallantoic membrane (CAM). Images were acquired after 24 hrs incubation with 0 µg/mL (B), 5 µg/mL (C) or, 50 µg/mL (D) of K562 derived exosomes. Whiskers plots of the percentage of newly formed vessels after exposure to 5 µg/mL (gray bars) or 50 µg/mL (black and white bars) of K562 exosomes (E). Bars represent the maximum, minimal, and mean of at least seven independent experiments, represented as dots (5 µg/mL) and squares (50 µg/mL), normalized to the number of tertiary veins obtained after exposure to phosphate buffer saline (PBS) and to the normalized number obtained in the corresponding CAM area at 0 hrs incubation in the same embryo. Dotted line at 100% normalized newly formed vessels refers to the control sample – number of tertiary veins obtained after exposure to PBS and to the normalized number obtained in the corresponding CAM area at 0 hrs incubation. ***p-value 0.0003, **p-value 0.0056, *p-value 0.13 comparing to the CAM regions exposed to PBS. p-value was calculated using an unpaired t-test with Welch’s correction.
Abbreviation: PBS, phosphate buffer saline.

