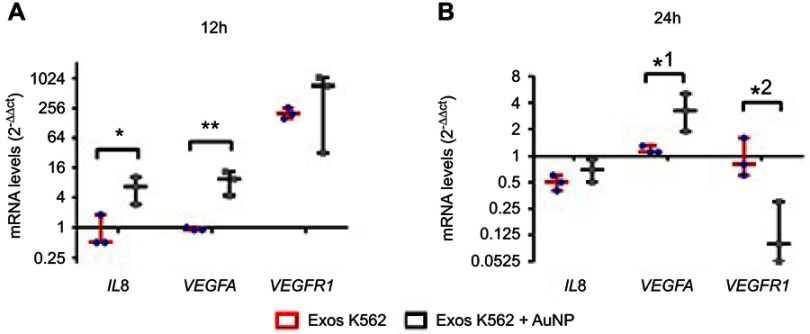
Figure 4.
Whiskers plots of IL8, VEGFA , and VEGFR1 mRNA levels after (A) 12 hrs and (B) 24 hrs of CAM exposure to Exosomes from K562 cells (50 µg/mL) (Exos K562, red bars with blue dots), or a mixture of K562 exosomes (50 µg/mL) and 16.4 nM antiangiogenic-AuNPs (Exos K562+ AuNP, black bars with gray squares). Data were normalized relatively to GAPDH mRNA levels and subsequent normalization with CAM treated with PBS. With this procedure, PBS (control) equals to 1 for all analyzed proteins. *p-value 0.014, **p-value 0.004, *1 p-value 0.035, *2 p-value 0.022 relative to the same gene in CAM treated with exosomes alone.
Abbreviations: CAM, chorioallantoic membrane; PBS, phosphate buffer saline.

