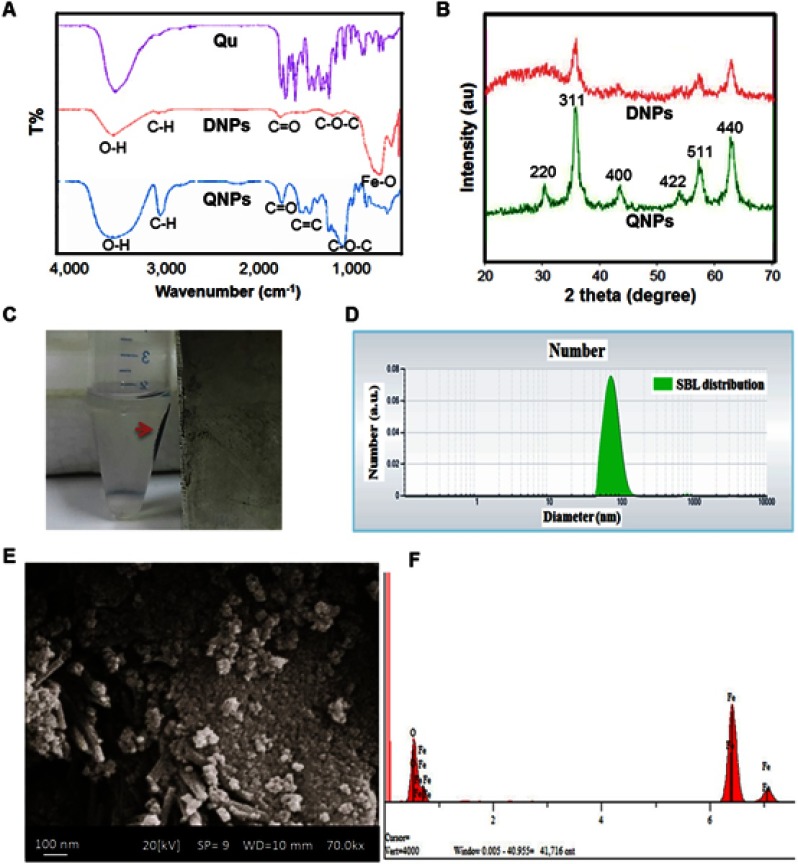
Figure 2.
Physicochemical characterization of DNPs and QNPs. (A) The results of FTIR confirmed that the polymerization of dextran on and conjugation of Qu to the surface of IONPs was correctly performed. (B) The XRD image showed that DNPs and QNPs were in pure crystal phase and verified Fe3O4 identity. (C) The magnetic properties of QNPs (red arrow shows QNPs aggregate). The DLS results (D) and the SEM pictures (E) of QNPs confirmed the size of the NPs was in the nanometer range. (F) The EDX spectroscopy verified the identity of the IONPs.

