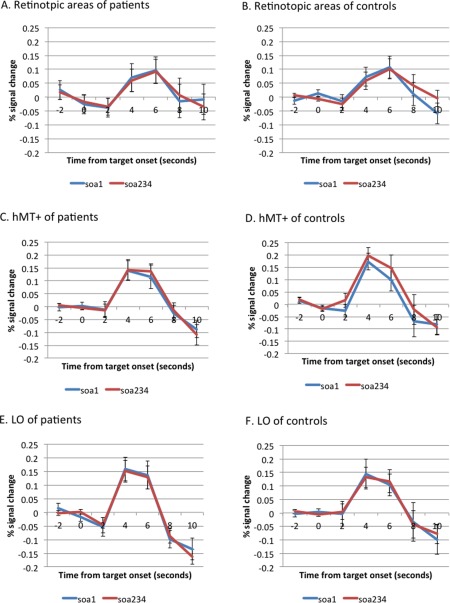
Figure 2.

Time series of the visual processing regions of interest. These figures show the time series of percent signal change for each region of interest in schizophrenia patients (the left panel) and siblings (the right panel). The abscissa reflects the time since target onset and the ordinate indicates percent signal change. A (patients) and B (controls), retinotopic areas. C (patients) and D (controls), the human motion‐sensitive cortex (hMT+). E (patients) and F (controls), the lateral occipital complex (LO). Values are presented as mean (SE). The SOAs between the onset of a target and the onset of a 4‐dot mask were 0, 50, 100, and 150 ms for SOAs 1, 2, 3, and 4. The SOA234 indicates the combined responses for SOAs 2,3,4. [Color figure can be viewed in the online issue, which is available at http://wileyonlinelibrary.com.]
