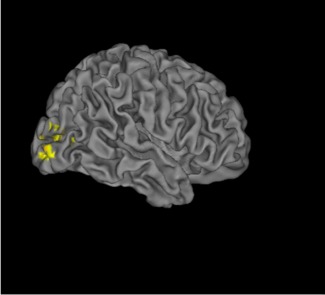
Figure 4.

Whole brain analyses. This figure shows increased activations in the right middle occipital gyrus in controls for SOA1 vs. SOA234 in the whole brain analyses. The coordinates of the area are presented in the text. The SOAs between the onset of a target and the onset of a 4‐dot mask were 0, 50, 100, and 150 ms for SOAs 1, 2, 3, and 4. The SOA234 indicates the combined responses for SOAs 2,3,4.
