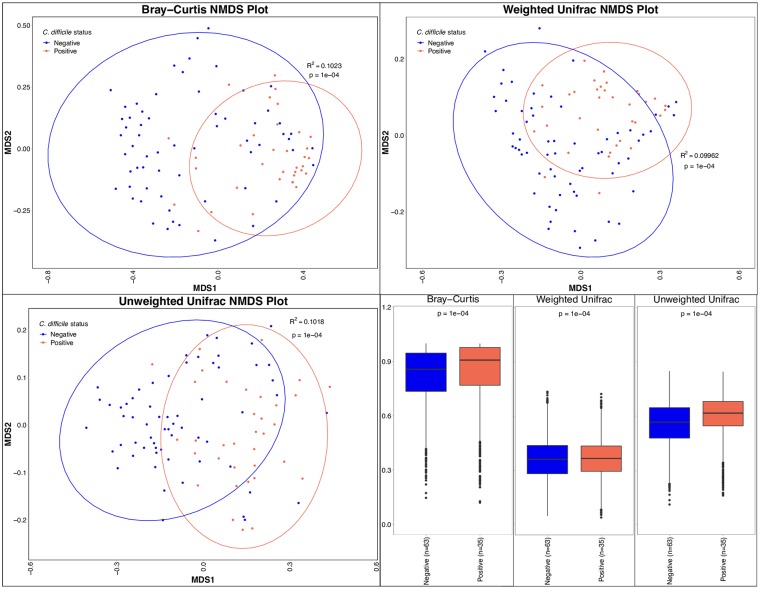
Fig 3. Non-metric Multidimensional Scaling (NMDS) plots and box plots show the dissimilarity in bacterial communities in C. difficile-positive and C. difficile-negative fecal samples from puppies in the greater Philadelphia area.
Ellipses on NMDS plots display 95% confidence intervals. P-values were calculated using PERMANOVA. The dissimilarity among C. difficile positive puppies is displayed in the left boxplots and the dissimilarity between culture positive and negative puppies is displayed in the right boxplots. Boxes display the median, first and third quartiles, and whiskers extend to the minimum and maximum, while points represent outliers.

