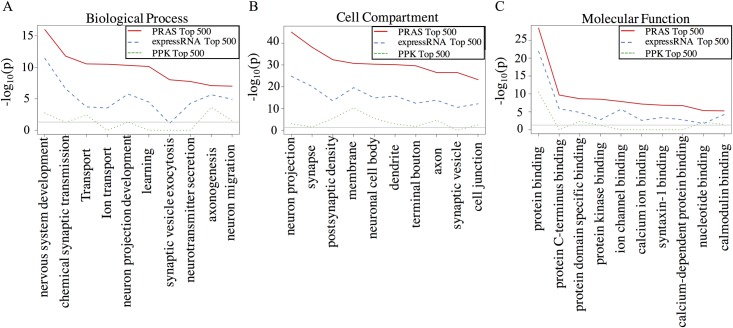
Fig 5. GO analysis of the top ranked targets in different methods and top differentially expressed genes.
(A) “Biological Process” GO analysis line-chart. X-axis represents the GO term and Y-axis is the–log10(p-value) from the David GO analysis tool (https://david.ncifcrf.gov/) for the top 500 targets ranked by each method. PRAS is highlighted by red solid line, expressRNA is highlighted by blue dashed line, and PPK is highlighted by green dotted line. (B) Similar plot to A but for “Cell Compartment” GO analysis. (C) Similar plot to A but for “Molecular Function” GO analysis.

