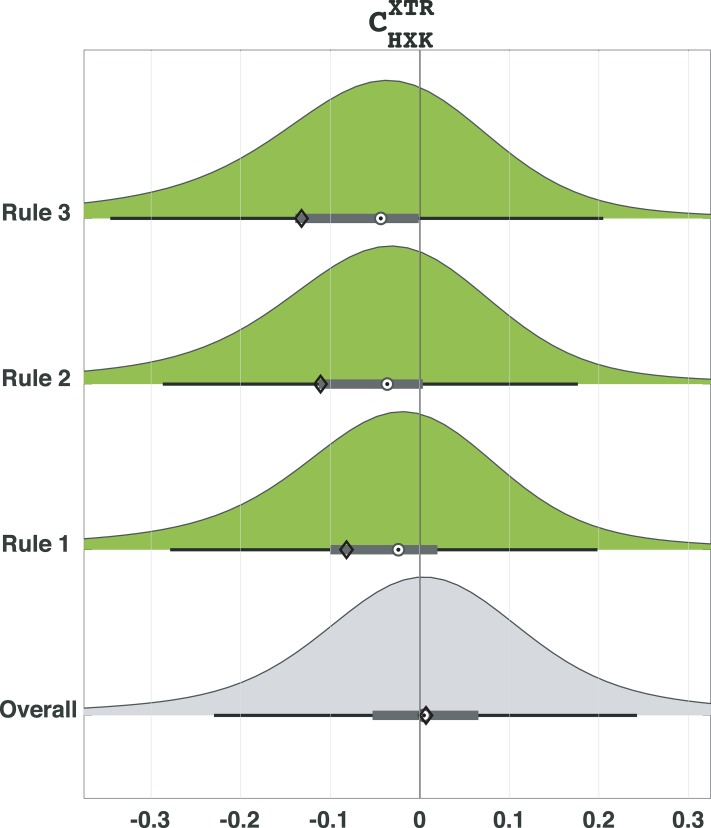
Fig 2. The distributions of control coefficients of XTR with respect to HXK for Rules 1, 2 and 3 were clearly shifted toward negative values compared to the one for the overall population of parameter sets.
The horizontal box plots describe the inter-quartile range (gray box), median (target circle), mean (diamond) and the range of +/- 2.7 standard deviations around the mean (whiskers) of the distributions.

