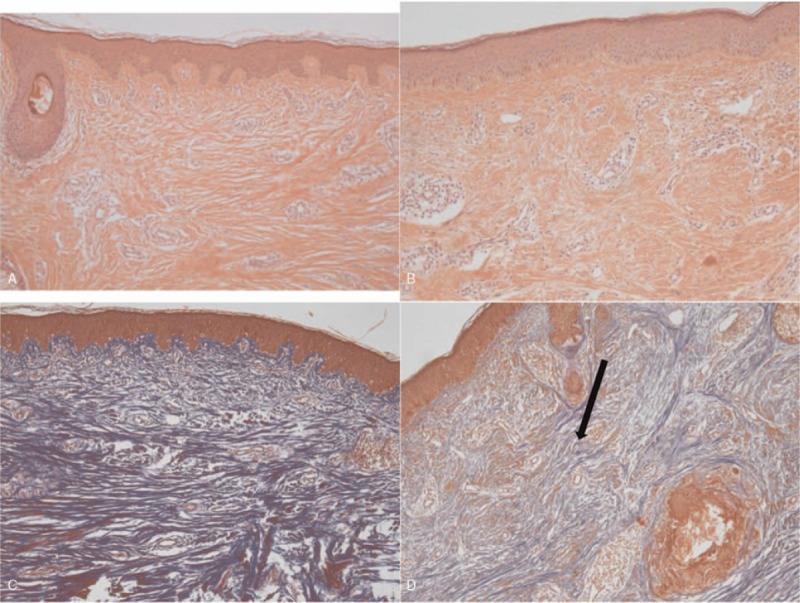
Figure 3.

Representative biopsy specimen with hematoxylin and eosin stain (upper, ×100) and Masson trichrome stain (lower, ×100). Left column, control group. Right column, botulinum toxin A (BoNTA) group. Note the denser deposition of collagen fibers of control group compared with BoNTA group in both stains (arrows).
