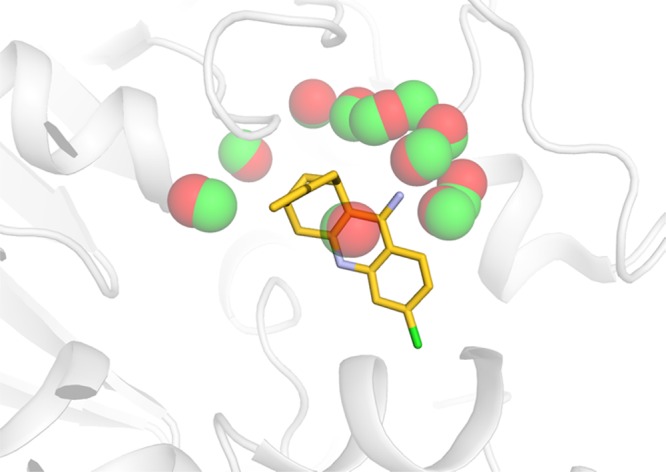
Figure 7.

Overlap between hydration networks from simulations carried out in the presence (red) and absence (green) of the ligand for acetylcholinesterase. The hydration sites determined with the ligand present and absent are shown as red and green spheres, respectively. The protein is shown as a gray cartoon, and the cocrystallized ligand is shown in sticks.
