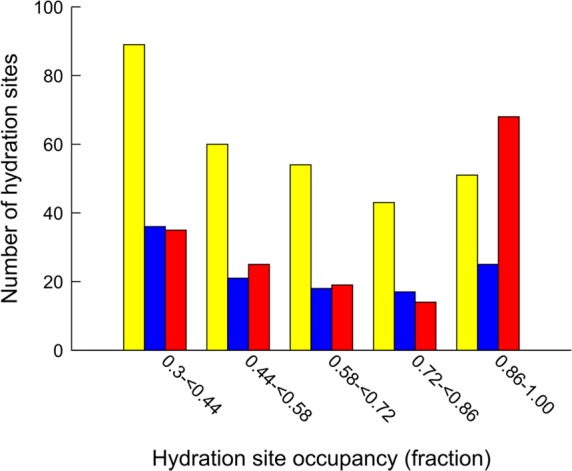
Figure 8.

Distribution of the number of hydration sites over different occupancy intervals from simulations with the ligand absent and present. Yellow bars represent all hydration sites obtained with the ligands absent, whereas the blue bars show the distribution after removing sites that overlapped with the ligands. Red bars represent hydration sites obtained with the ligands present.
