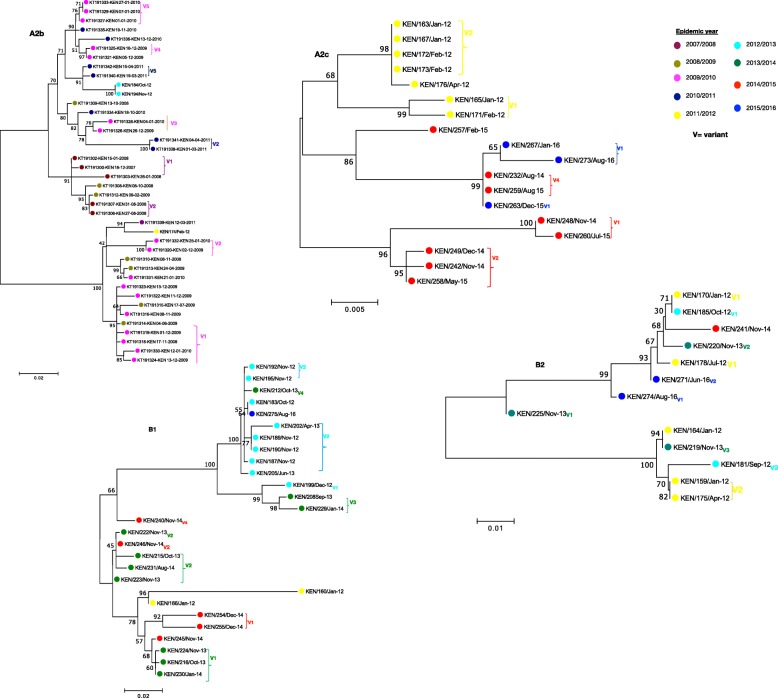
Fig. 6.
ML phylogenies by subgroup for G gene Kilifi sequences colored by epidemic, from 2007 to 2016. The numbers next to branches indicate the bootstrap values, a branch with > 70% bootstrap value was considered as a major branch. Different variants observed within an epidemic are indicated next to branches colored by epidemic year. Cut off > = 70% bootstrap support was considered significant for variant assignment. The nucleotide differences between the variants are shown in Additional files 4 and 5

