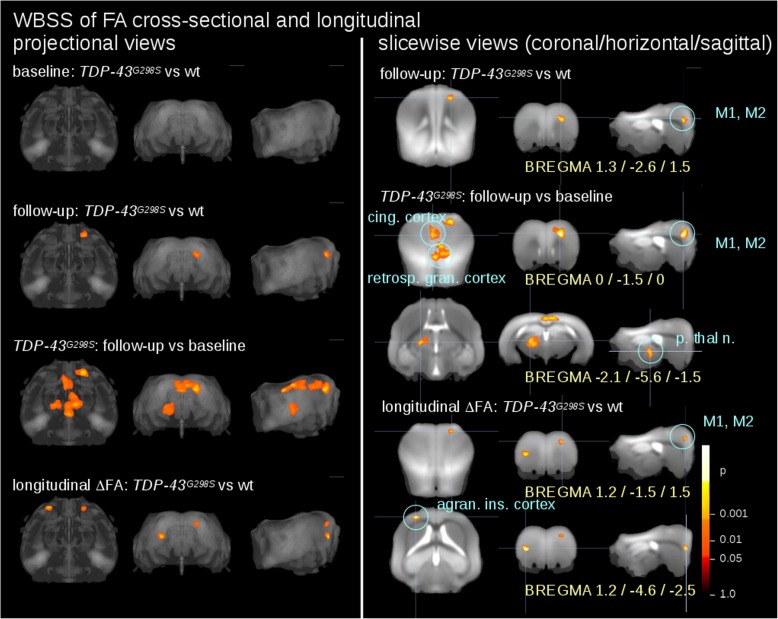
Fig. 2.
Whole brain-based spatial statistics (WBSS) for the comparison of FA values and for the comparison of ΔFA. Cross-sectional comparisons were performed for TDP-43G298S mice vs wt at baseline and at follow-up and for TDP-43G298S mice follow-up data vs baseline data; longitudinal comparison (ΔFA) was performed for TDP-43G298S mice vs wt. Left panel: projectional views. Right panel: slicewise presentation of results clusters. Hot colors indicate an FA reduction or an increased ΔFA, respectively. M1, M2 – motor area 1,2, p. thal. n. – posterior thalamic nucleus, cing. Cortex – cingulate cortex, retrosp. Gran. Cortex – retrosplenial granular cortex, agran. Ins. cortex – agranular insular cortex

