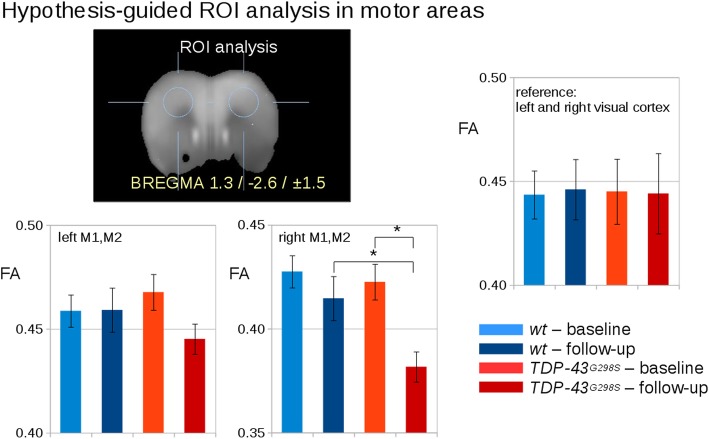
Fig. 3.
Hypothesis-guided analysis of FA values for TDP-43G298S and wt mice at baseline and at follow-up. Left: Spherical ROI analysis in the motor areas M1,M2 (BREGMA -1.4 / 1.7 / ±1.5) show a bihemispherical reduction of FA values in motors areas M1 and M2 . Right: ROI based FA analysis in the visual cortex (BREGMA -4.4 / 1.7 / ±3.0). *significance p < 0.05. Error bars are given as standard error of the mean (SEM)

