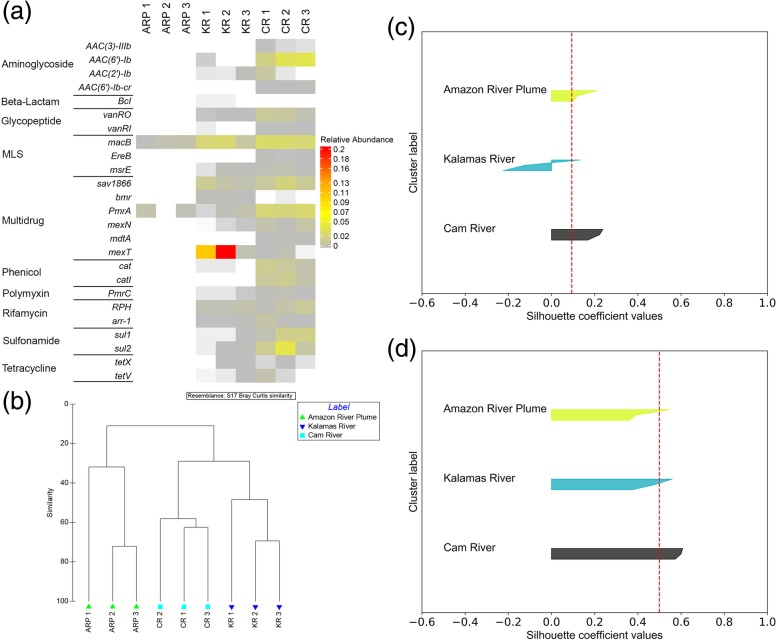
Fig. 5.
a Heatmap and b hierarchical clustering of different riverine samples based on the relative abundance of discriminatory ARGs. c Silhouette plot for riverine samples using all the annotated ARGs. d Silhouette plot for riverine samples using the discriminatory ARGs. (Legend: ARP: Amazon River Plume, KR: Kalamas River, CR: Cam River)

