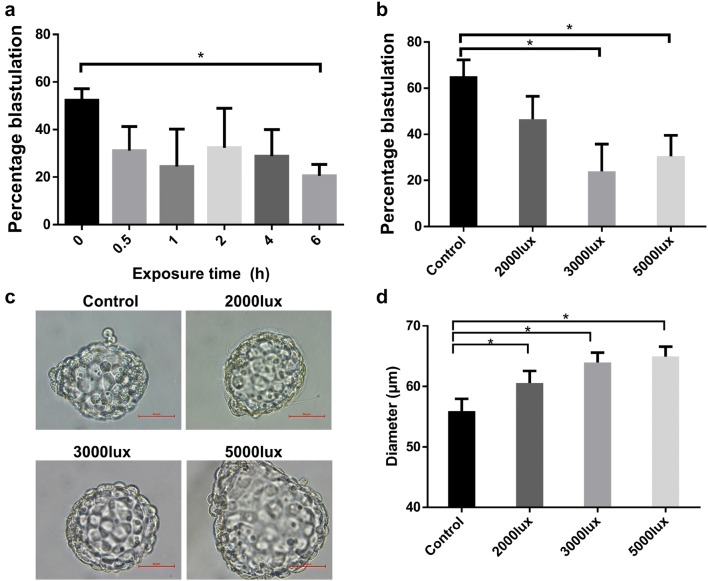
Fig. 1.
Effects of exposure time and light intensity on blastulation and morphology. a Blastulation percentages in different exposure time groups (total 227, 102, 98, 103, 104, and 118 embryos at the 2-cell stage after 0 h, 0.5 h, 1 h, 2 h, 4 h, and 6 h, respectively). b Blastulation percentages in different illumination intensity groups (total 332, 131, 152, and 191 embryos at the 2-cell stage under control, 2000 lx, 3000 lx, and 5000 lx exposure, respectively). c Representative images of blastocyst morphology after light exposure, scale bars = 50 μm. d Diameters of blastocysts after light exposure (67, 34, 47, and 52 blastocysts under control, 2000 lx, 3000 lx, and 5000 lx exposure, respectively). *p < 0.05, biological replicates ≥ 3, mean ± SE

