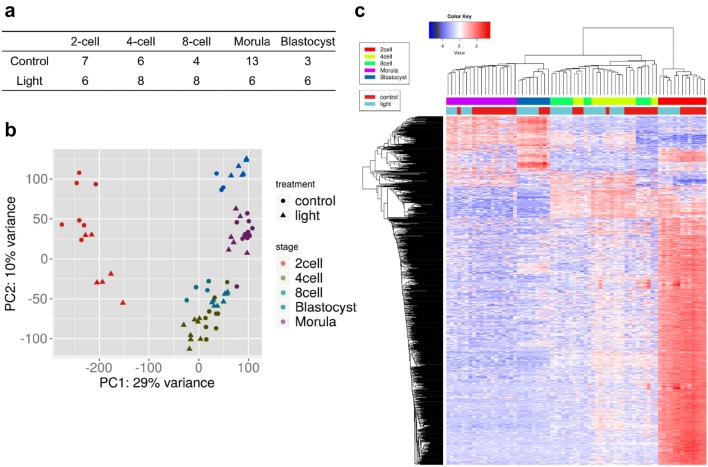
Fig. 2.
Single-cell RNA-seq transcriptome profiling of preimplantation embryos after light exposure. a Number of cells at each embryonic stage (2-cell to blastocyst) retained after quality filtering. b Two-dimensional PCA representation of single-cell transcriptomes. c Hierarchical clustering of highly viable genes across all cells

