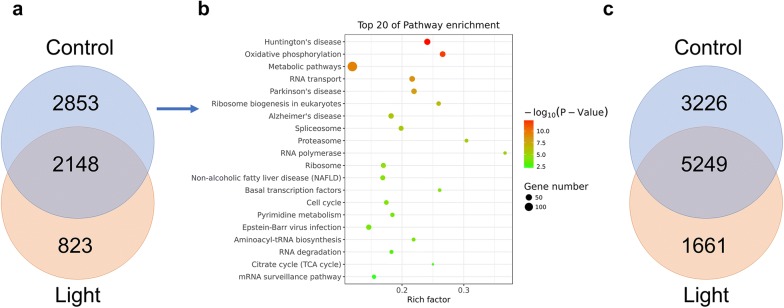
Fig. 5.
Maternal-to-zygotic transition in embryos exposed to light. a Venn diagram of genes upregulated at the 4-cell stage compared to the 2-cell stage in both control and light conditions; b bubble plot of the top 20 enriched GO terms from the analysis of the 2853 DEGs in the control group from a. c Venn diagram of genes downregulated at the 4-cell stage compared to the 2-cell stage in both control and light conditions

