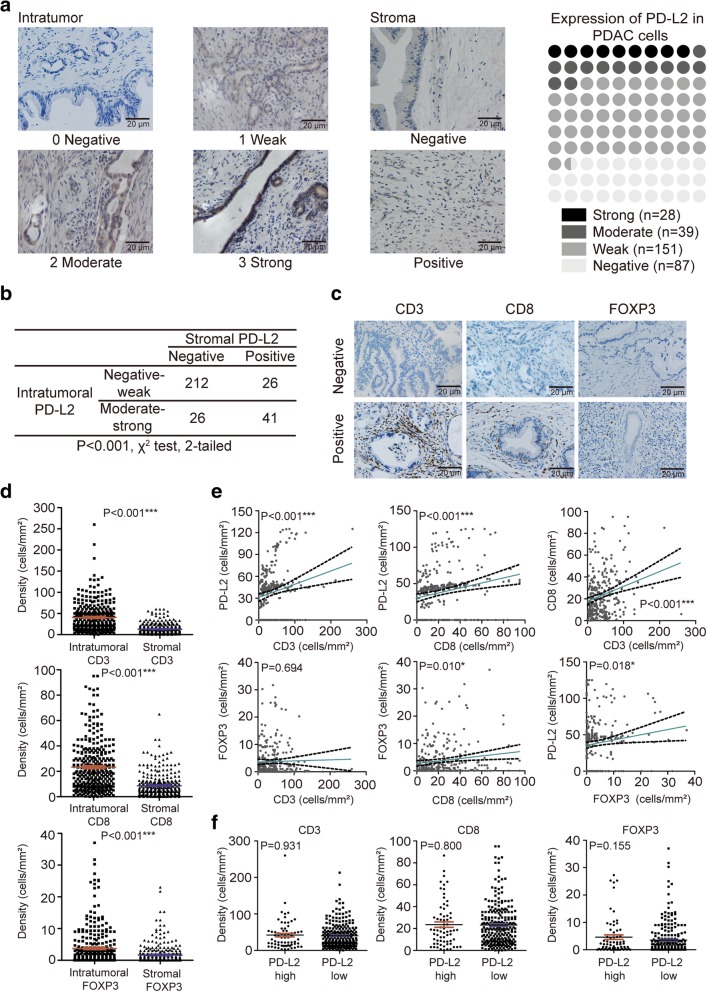
Fig. 1.
PD-L2 in PDAC. a Stratification of PD-L2 expression in PDAC cells (scales bar: 20 μm) and in the stroma. b Statistical results of correlation between intratumoral and stromal PD-L2 using the χ2 test. c Expression of CD3, CD8 and FOXP3 in PDAC TILs. d Comparison between intratumoral and stromal densities of CD3+, CD8+ and FOXP3+ T cells in PDAC using paired t tests. e Scatter plots with linear regression for 4 immune markers using Pearson’s correlation. f Relation among densities of CD3+, CD8+, and FOXP3+ T cells based on PD-L2 expression levels using the Mann-Whitney U test. * P < 0.05; **P < 0.01; ***P < 0.001

