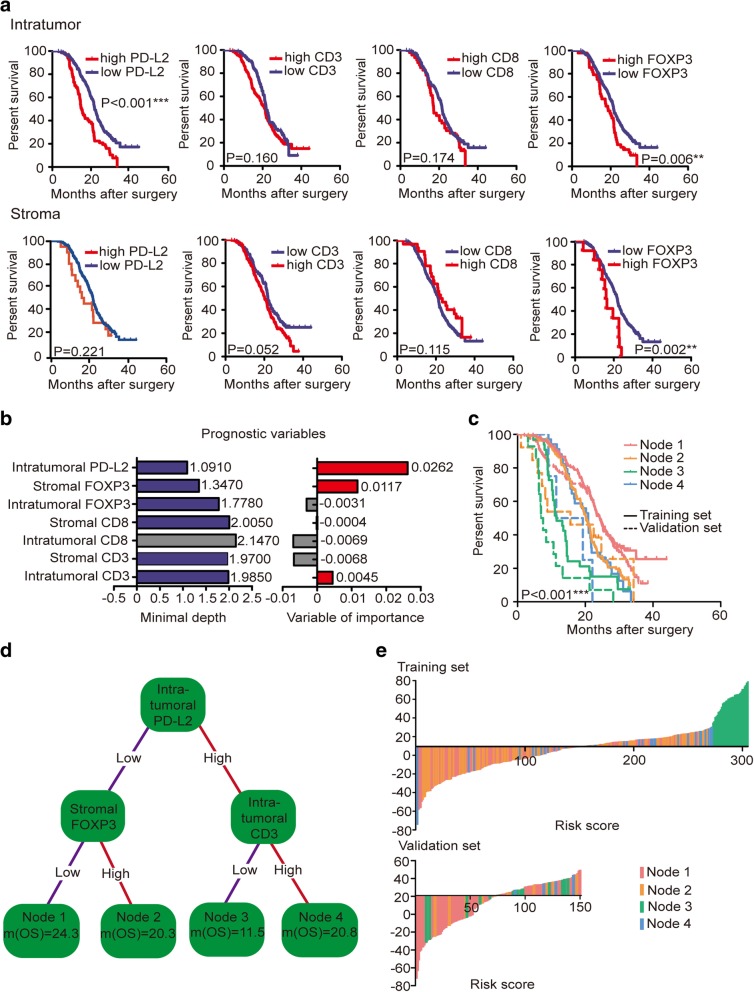
Fig. 2.
Prognostic association between different immune markers and OS. a Log-rank test showing associations between OS and immune markers in the tumor and stroma. b The RSF model using the minimal depth and VIMP of prognostic variables in predicting OS. The variables most related to survival had smaller minimal depth and greater importance. The minimal depth ruled out the maximum variable, and VIMP ruled out variables with negative properties (colored in gray). c Survival curves of 4 nodes in the training set and the validation set. d A survival tree was generated using variables selected by the RSF model. Each variable has 2 nodes per branch depending on survival. e Waterfall plot showing relevant risk scores of four immune marker-based signatures in the training set and the validation set

