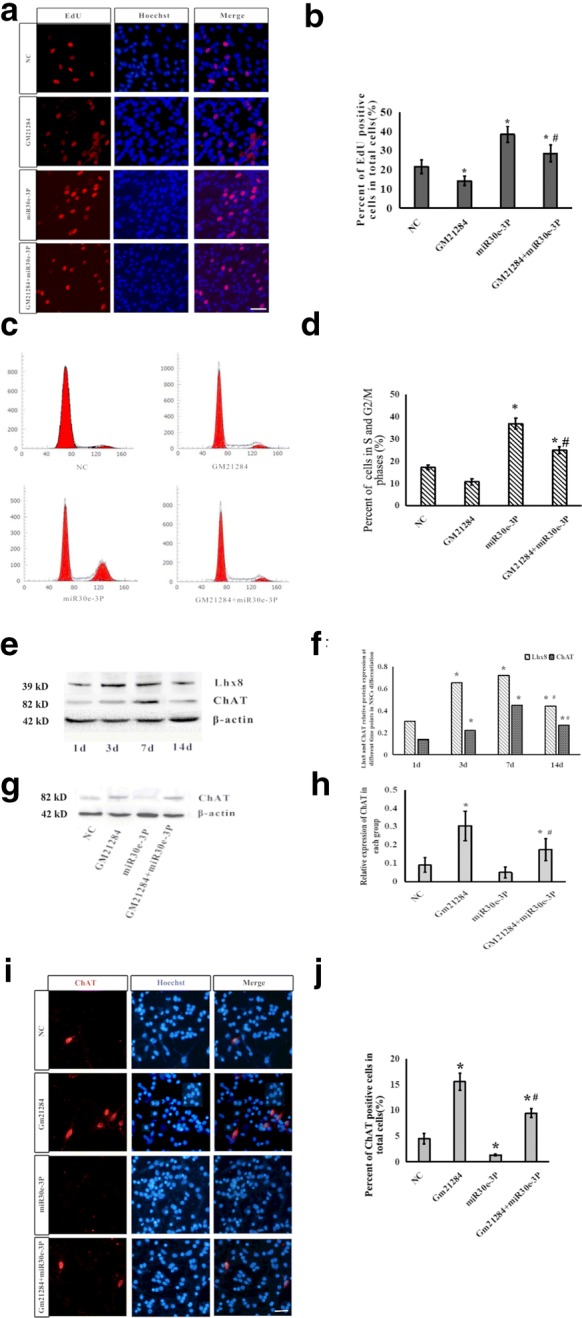
Fig. 5.

Gm21284 promotes differentiation of NSCs to cholinergic neurons by competitive inhibition of miR-30e-3P. a Immunofluorescence images of EdU-positive cells in each group. b Statistical graph representing percentage of EdU-positive cells, *: vs. NC group, P < 0.05, #: vs. miR30e-3P group, P < 0.05. Scale bar = 50 μm. c FCS image of cell cycle of hippocampal NSCs in each group. d Statistical graph of percentage of cells in the S and G2/M phases, *: vs. NC group, P < 0.05, #: vs. miR30e-3P group, P < 0.05. e Western blot detected the expression of LhX8 and ChAT at different time points in differentiating NSCs. f Statistical graph of expression of LhX8 and ChAT, *: vs. 1 day, P < 0.05; #: vs. 7 days, P < 0.05. g Western blot detected the expression of ChAT in each group at 7 days. h Statistical graph of expression of ChAT, *: vs. NC group, P < 0.05; #: vs. miR30e-3P group, P < 0.05. i Immunofluorescence images of cells at 7 days after differentiation of NSCs to cholinergic neurons. j Statistical graph of percentage of ChAT-positive cells, *: vs. NC group, P < 0.05; #: vs. miR30e-3P group, P < 0.01. Scale bar = 50 μm
