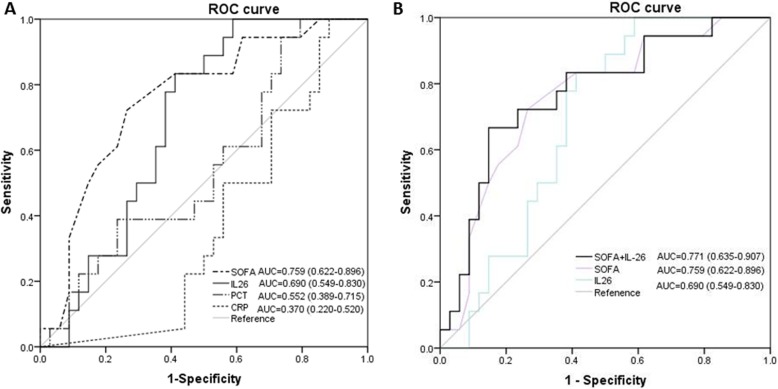
Fig. 4.
a Receiving operating characteristic (ROC) curve of IL-26, SOFA score, PCT, and CRP at admission for predicting 28-day mortality in septic patients. Area under the ROC curve, 0.690 (p = 0.036) for IL-26, 0.759 (p = 0.019) for SOFA score, 0.552 (p = 0.091) for PCT, and 0.370 (p = 0.265) for CRP. b Receiving operating characteristic (ROC) curve of IL-26 in combination with SOFA score for predicting 28-day mortality in septic patients. Area under ROC curve for the combination of IL-26 and SOFA score, 0.771 (p = 0.017)

