Fig. 2.
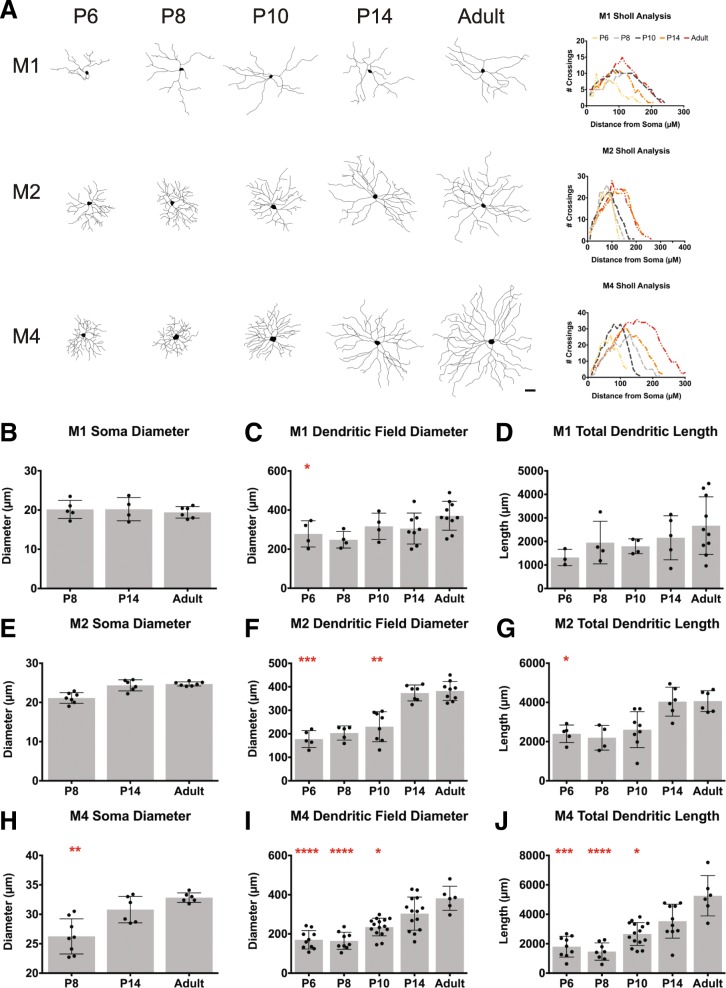
Dendritic length and diameter measurements for M1, M2, M4 subtypes during development. a Representative cell tracings of M1, M2, and M4 subtypes for P6, P8, P10, P14, Adult timepoints (left) and corresponding Sholl analysis for representative cells (right). b-d Mean ± SD M1 ipRGC soma diameter (b), dendritic field diameter (c), and total dendritic length (d). e-g Mean ± SD M2 ipRGC soma diameter (e), dendritic field diameter (f), and total dendritic length (g). h-j Mean ± SD M4 ipRGC soma diameter (h), dendritic field diameter (i), and total dendritic length (j). Scale bar is 50 μm, n = 5–8 per subtype/age,*p < 0.05, **p < 0.01, ***p < 0.001, ****p < 0.0001 when compared to Adult time point

