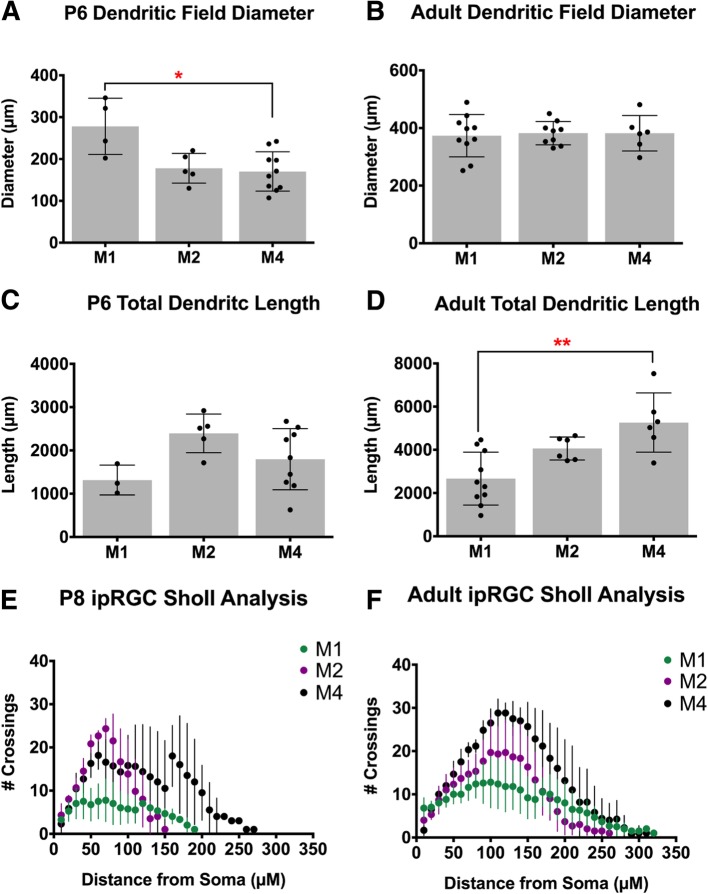
Fig. 3.
Comparison of ipRGC subtype morphology at P6 and in Adulthood. a, b Mean ± SD dendritic field diameter at P6 (A) and Adult (B) for M1, M2, and M4 ipRGCs. c, d Mean ± SD total dendritic length at P6 (c) and Adult (d) for M1, M2, and M4 ipRGCs. e, f Mean ± SD number of crossings in Sholl analysis of M1, M2, and M4 ipRGCs at P8 (e) and Adult (f). n = 5–8 per subtype/age, *p < 0.05, **p < 0.01

