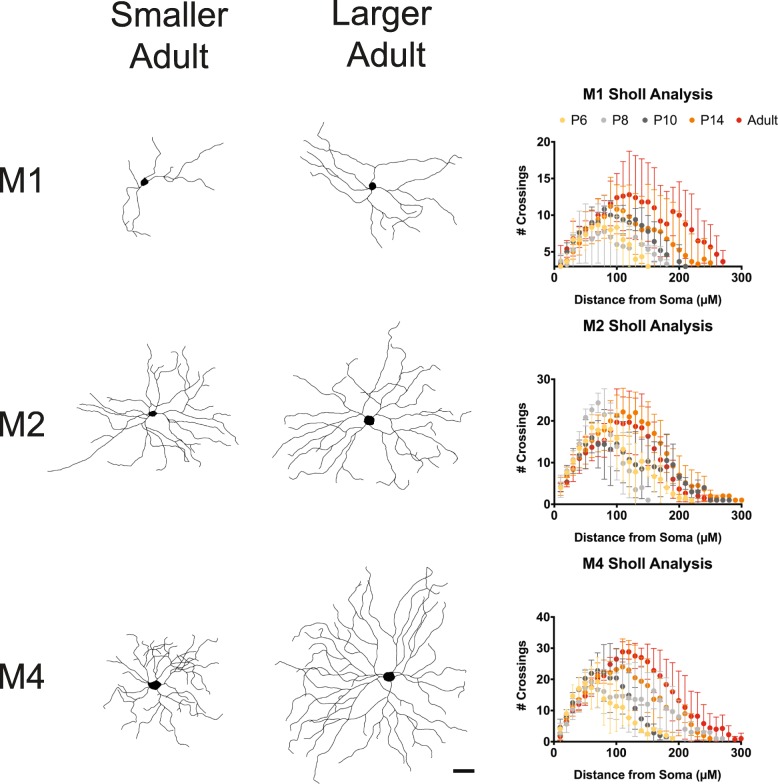
Fig. 4.
M1 and M4 subtypes have large variation of morphology in adulthood, Left, Representative cell tracings of small and large Adult cells for the M1, M2, and M4 subtypes. Right, Average Sholl analysis for M1, M2, and M4 subtypes at P6, P8, P10, P14, and Adult. Graphs are Mean ± SD, n = 5–8 per subtype/age. Scalebar is 50 μm

