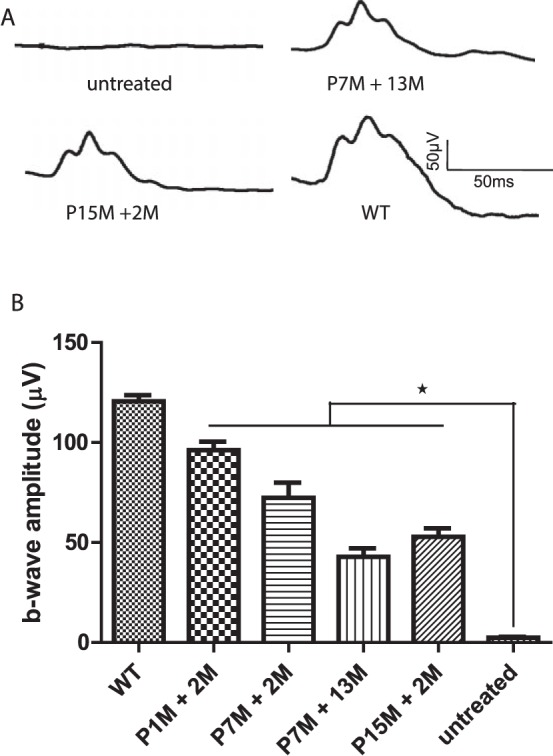
Figure 3.

(A) Representative ERG traces from an untreated Opn1mw−/− mouse (17 months old), Opn1mw−/− mouse treated at 7 months of age, and receiving ERG at 13 months postinjection (P7M +13M), Opn1mw−/− mouse treated at 15 months of age and receiving ERG at 2 months postinjection (P15M +2M), and wild-type control (WT, 17-month-old). (B) Averaged M-cone ERG responses in Opn1mw−/− mice treated at different ages. Untreated Opn1mw−/− mice (17 months old). Each bar represents the mean ± SEM of M-cone b-wave amplitudes recorded at 1.4 log cd.s/m2 (n = 7 for each group, *P < 0.001). P1M + 2M, treated at 1 month of age and receiving ERG at 2 months postinjection; P7M + 2M, treated at 7 months of age and receiving ERG at 2 months postinjection; P7M + 13M, treated at 7 months of age and receiving ERG at 13 months postinjection; P15M + 2M, treated at 15 months of age and receiving ERG at 2 months postinjection; WT, wild-type controls (17-month-old).
